
Monthly reports
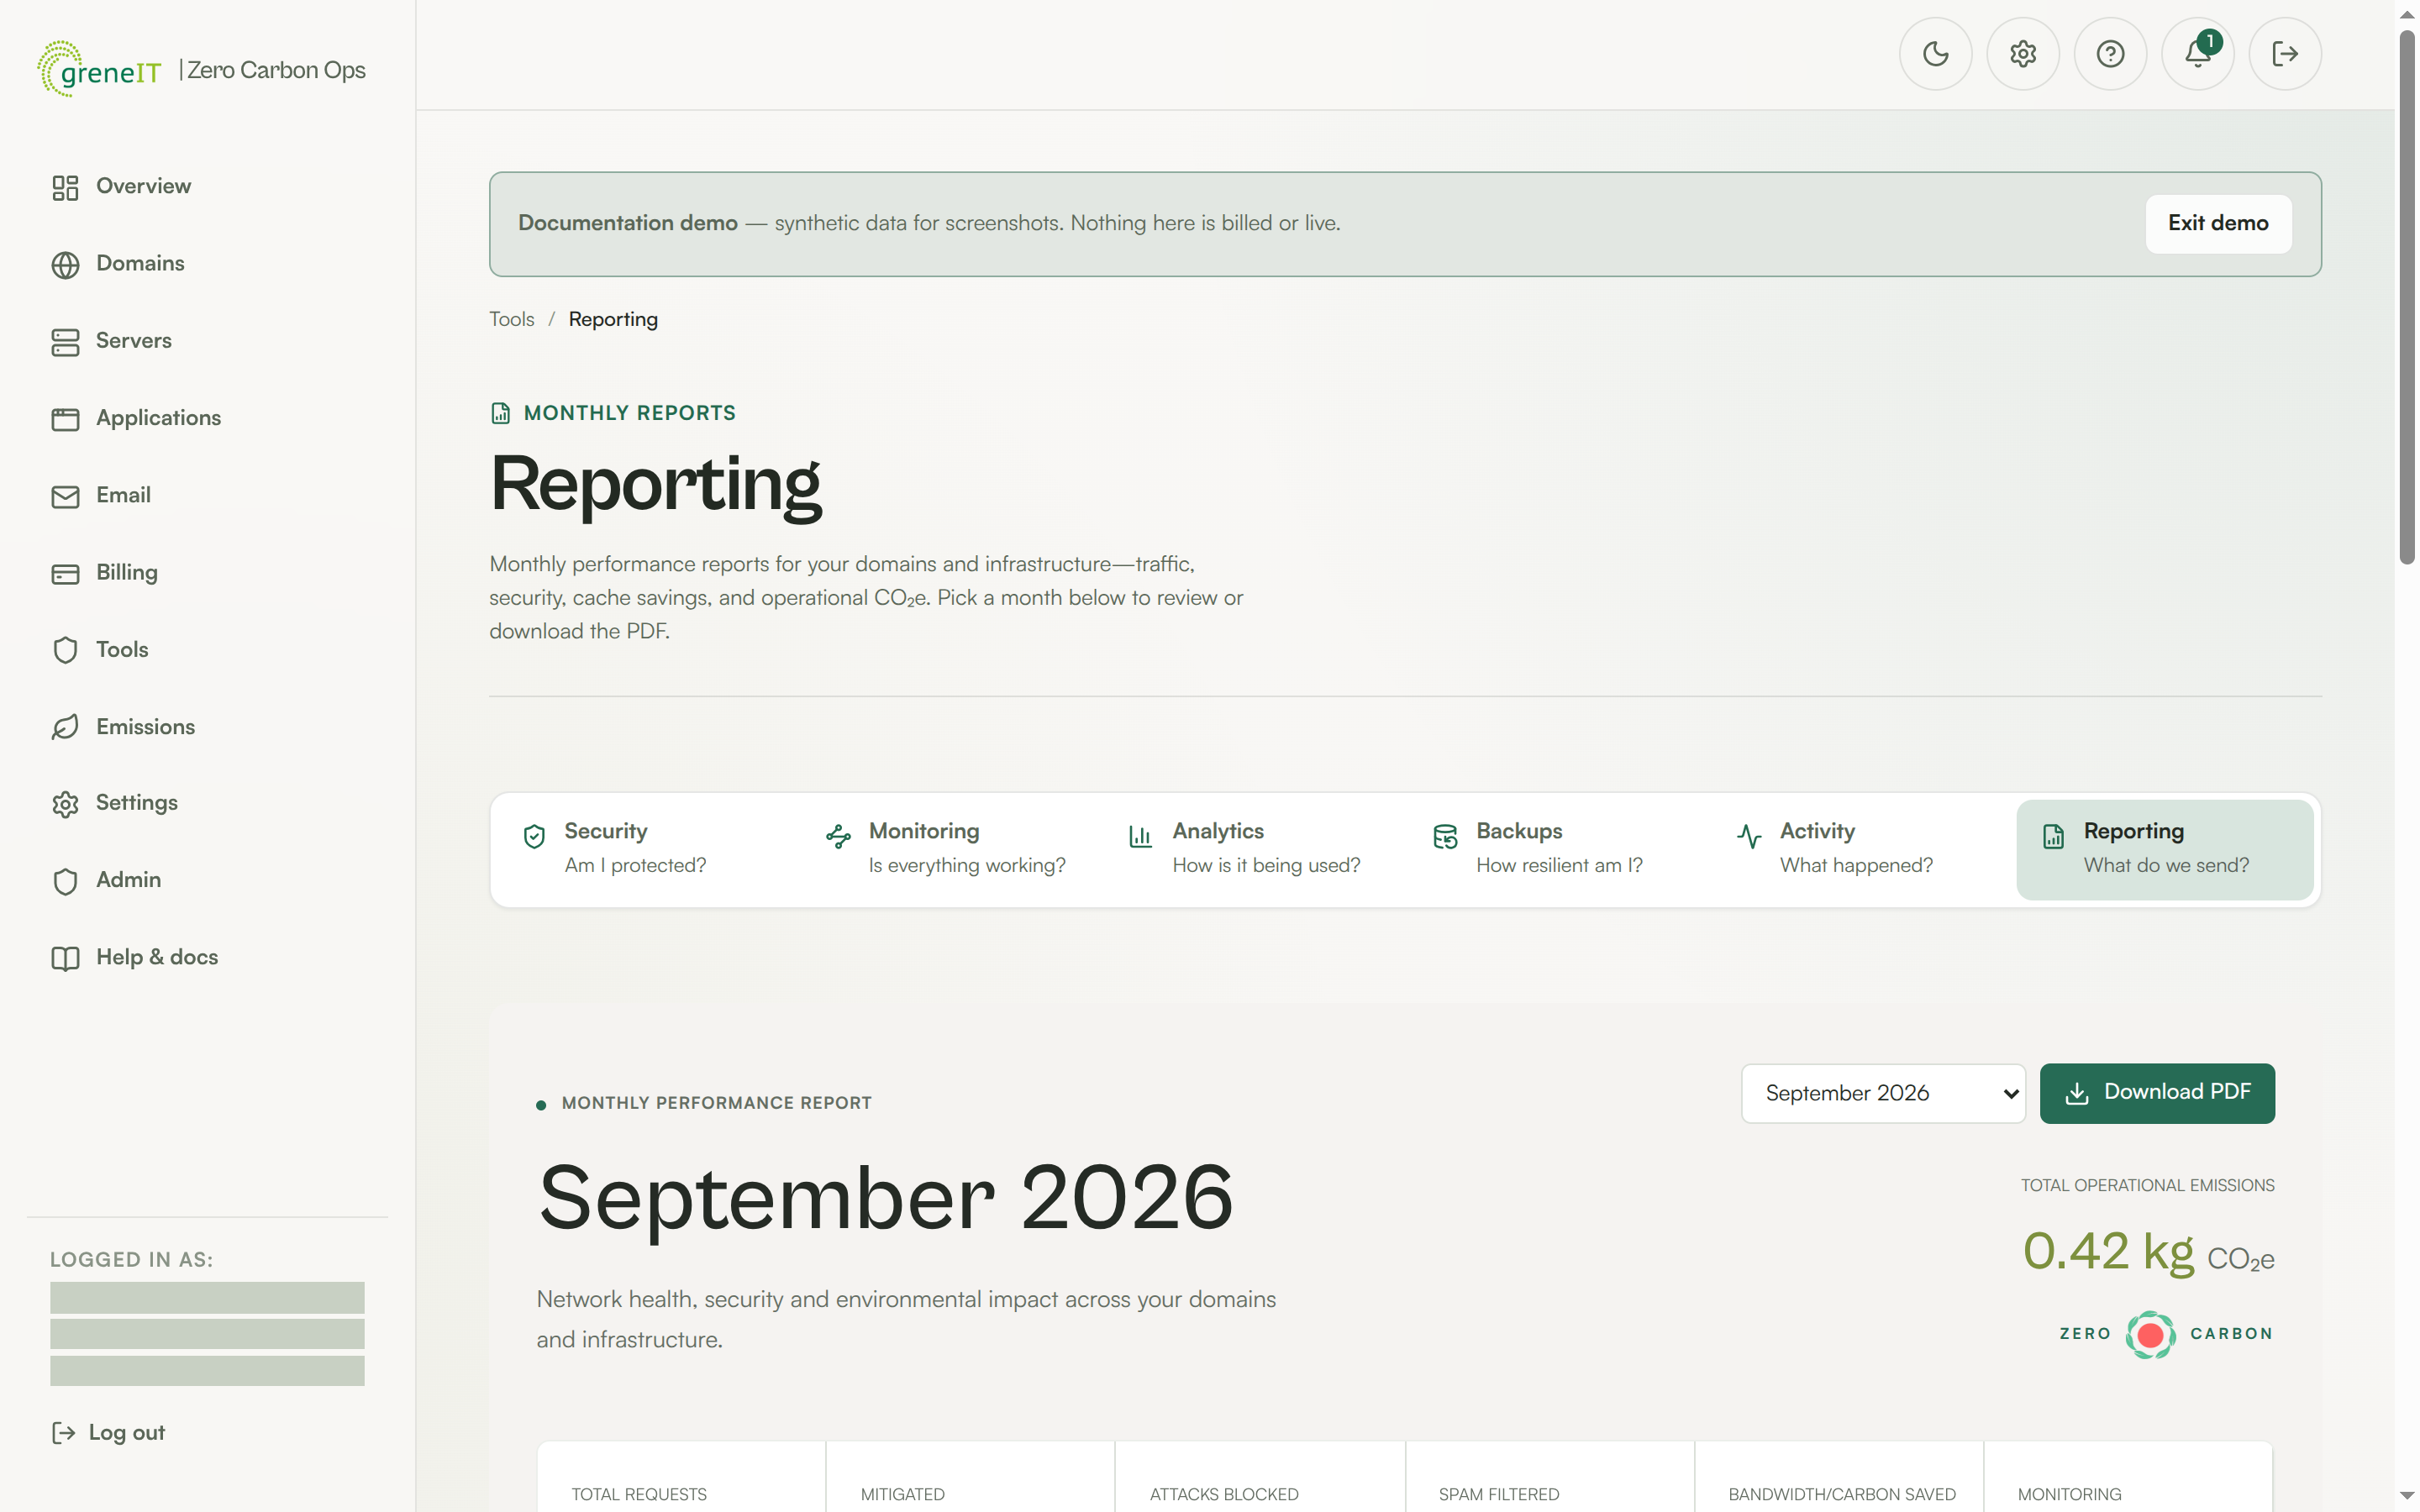
Tools → Reporting gives you a monthly performance report covering traffic, security, uptime and emissions. You can download it as a PDF to share with colleagues or include in sustainability reporting.
Email delivery
Section titled “Email delivery”At the start of each month, greneIT emails the previous calendar month’s report to the address on your account (the same address you use to sign in).
| When | Early in the month — typically on the 1st, with a short retry window if delivery fails. |
| Which month | Always the completed month before the send date (for example, a message in November covers October). |
| Who receives it | Accounts that had at least one active service during reporting — see below. |
| Sign-up only | If you registered but have not added a domain, server, application or mailbox yet, no report email is sent (there is nothing meaningful to report). |
When your account qualifies for email
Section titled “When your account qualifies for email”We send a monthly email only when your account includes at least one service that is not cancelled or removed, for example:
- a domain (registered, linked or in setup — not failed or deleted),
- a server (not destroyed),
- an application (not deleted), or
- an email mailbox.
If everything on the account has been removed or cancelled, you will not receive that month’s email. You can still open Tools → Reporting in the portal whenever you have access.
Choose a month and download
Section titled “Choose a month and download”- Pick the month from the drop-down. Months are available from July 2026 onward. The current month is marked (in progress).
- Click Download PDF.
You can read any available month in the portal even if you did not receive an email for that period (for example, if the account was empty at send time but you added services later).
What the report contains
Section titled “What the report contains”| Section | What it shows |
|---|---|
| Total operational emissions | The month’s emissions in kg CO₂e. Click the Zero Carbon mark to open an interactive visualisation on ephyrIOs. |
| Headline figures | Total requests, Mitigated (threats stopped at the edge), Attacks blocked (see next row), Spam filtered, Bandwidth/Carbon Saved, Monitoring (uptime %) and Emissions. |
| Attacks blocked | fail2ban ban events logged during that calendar month (each automatic block action). This is not the same as Blocked IPs in Tools → Security, which shows IPs still blocked right now. |
| Daily traffic trends | Traffic and mitigated requests per day. |
| Action points for the coming month | Recommendations based on the month’s data. |
| Putting … kg CO₂e in context | Your emissions compared with kettle boils, phone charges, miles driven and LED bulb hours. |
| Domain analysis | Requests, visitors, blocked requests and bandwidth saved per domain, with a health badge. |
| Servers, Application services, Email | Each service with a Healthy, Attention or Down badge. |
| Turnstile and email sending | Form spam protection and outbound email summary. |